Process Pulse
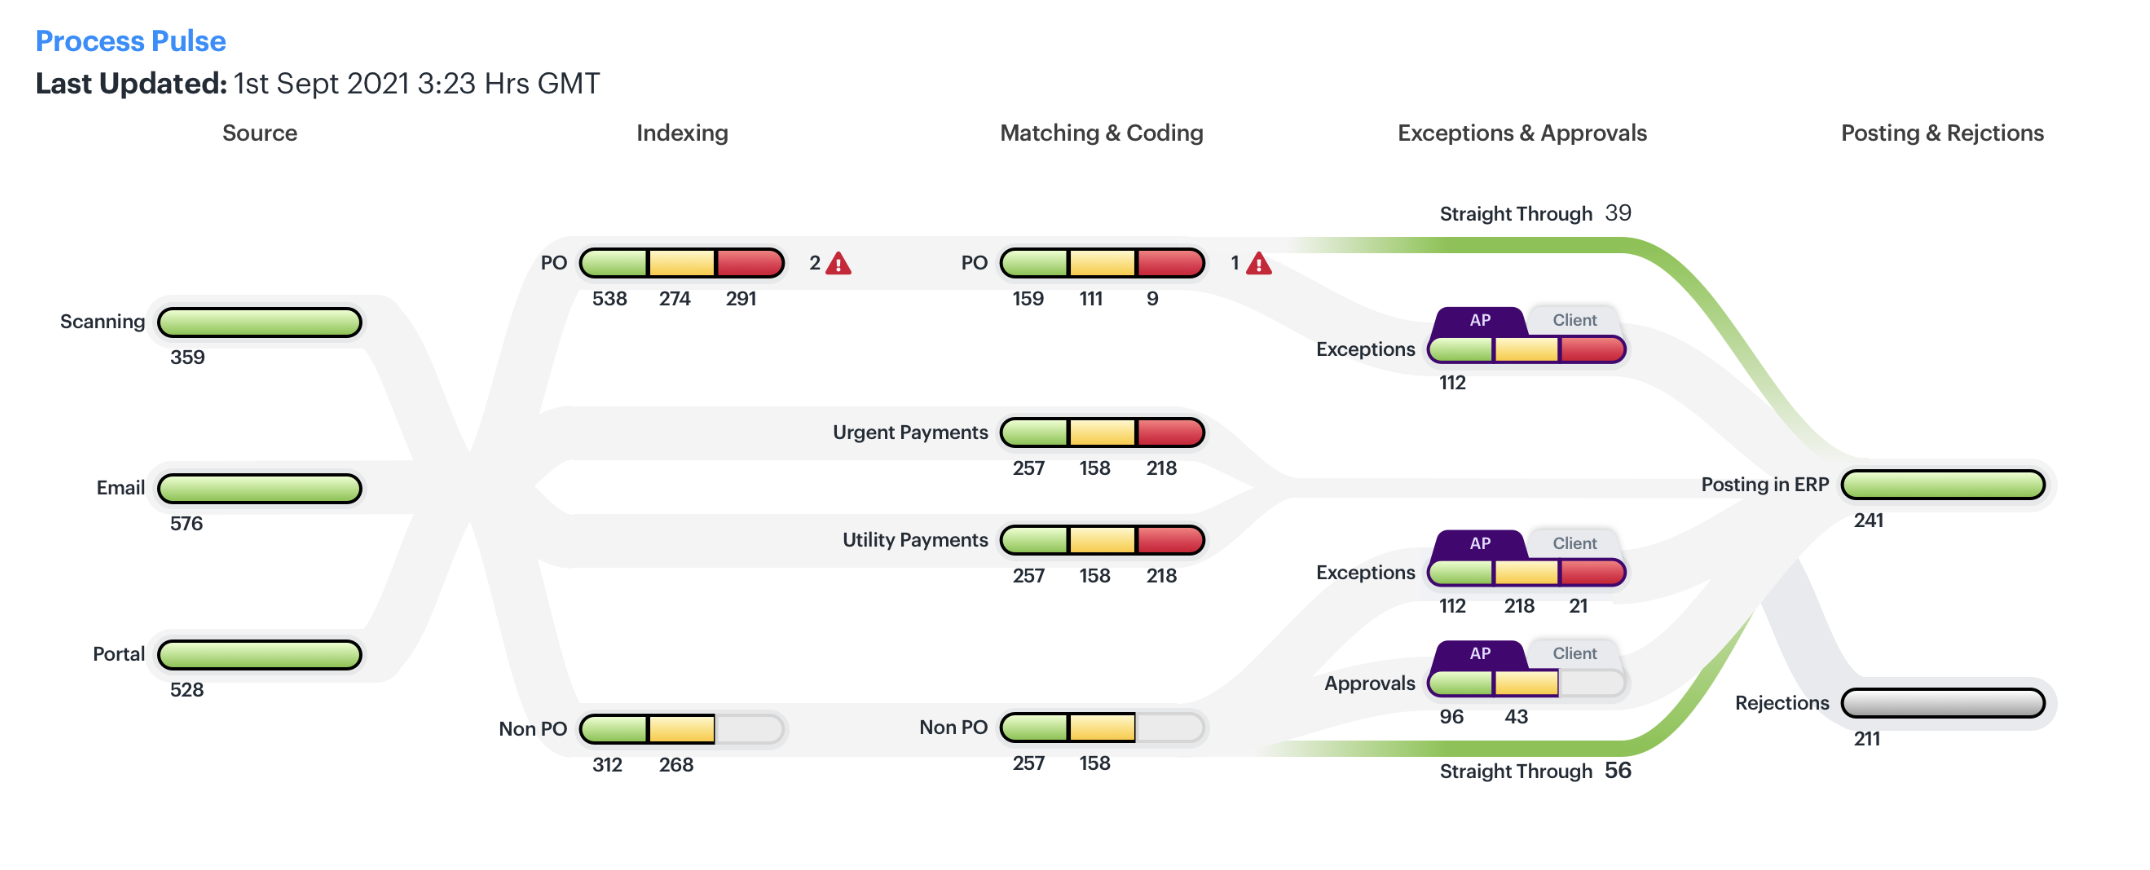
A Sankey-based dashboard that traces every invoice through sourcing, indexing, matching, exceptions and posting — surfacing straight-through rates and exception hotspots at a glance.
- ROLE
- Product Designer
- YEAR
- 2022
- SCOPE
- Procure-to-pay, 5 stages
- OUTPUT
- Web dashboard
- TEAM
- Accenture
The challenge
The procure-to-pay process runs through five stages, and understanding where invoices flowed straight through versus stalled meant a spreadsheet and a lot of explaining.
The approach
I designed a Sankey-based flow that traces every invoice from source to posting, with straight-through rates and exception hotspots surfaced directly on the flow so the state of the whole pipeline reads at a glance.
- Sankey flow
- Data viz
- Dashboard
The outcome
A five-stage pipeline became a single, readable flow — no walkthrough needed to see where invoices move cleanly and where exceptions pile up.