Reckoner
A single comparison view for demand planners weighing seven statistical forecasting models against each other, so the best fit for a SKU's seasonality is obvious without reading a formula.
- ROLE
- Product Designer
- YEAR
- 2021
- SCOPE
- Demand forecasting, 7 models
- OUTPUT
- Web dashboard
- TEAM
- Accenture
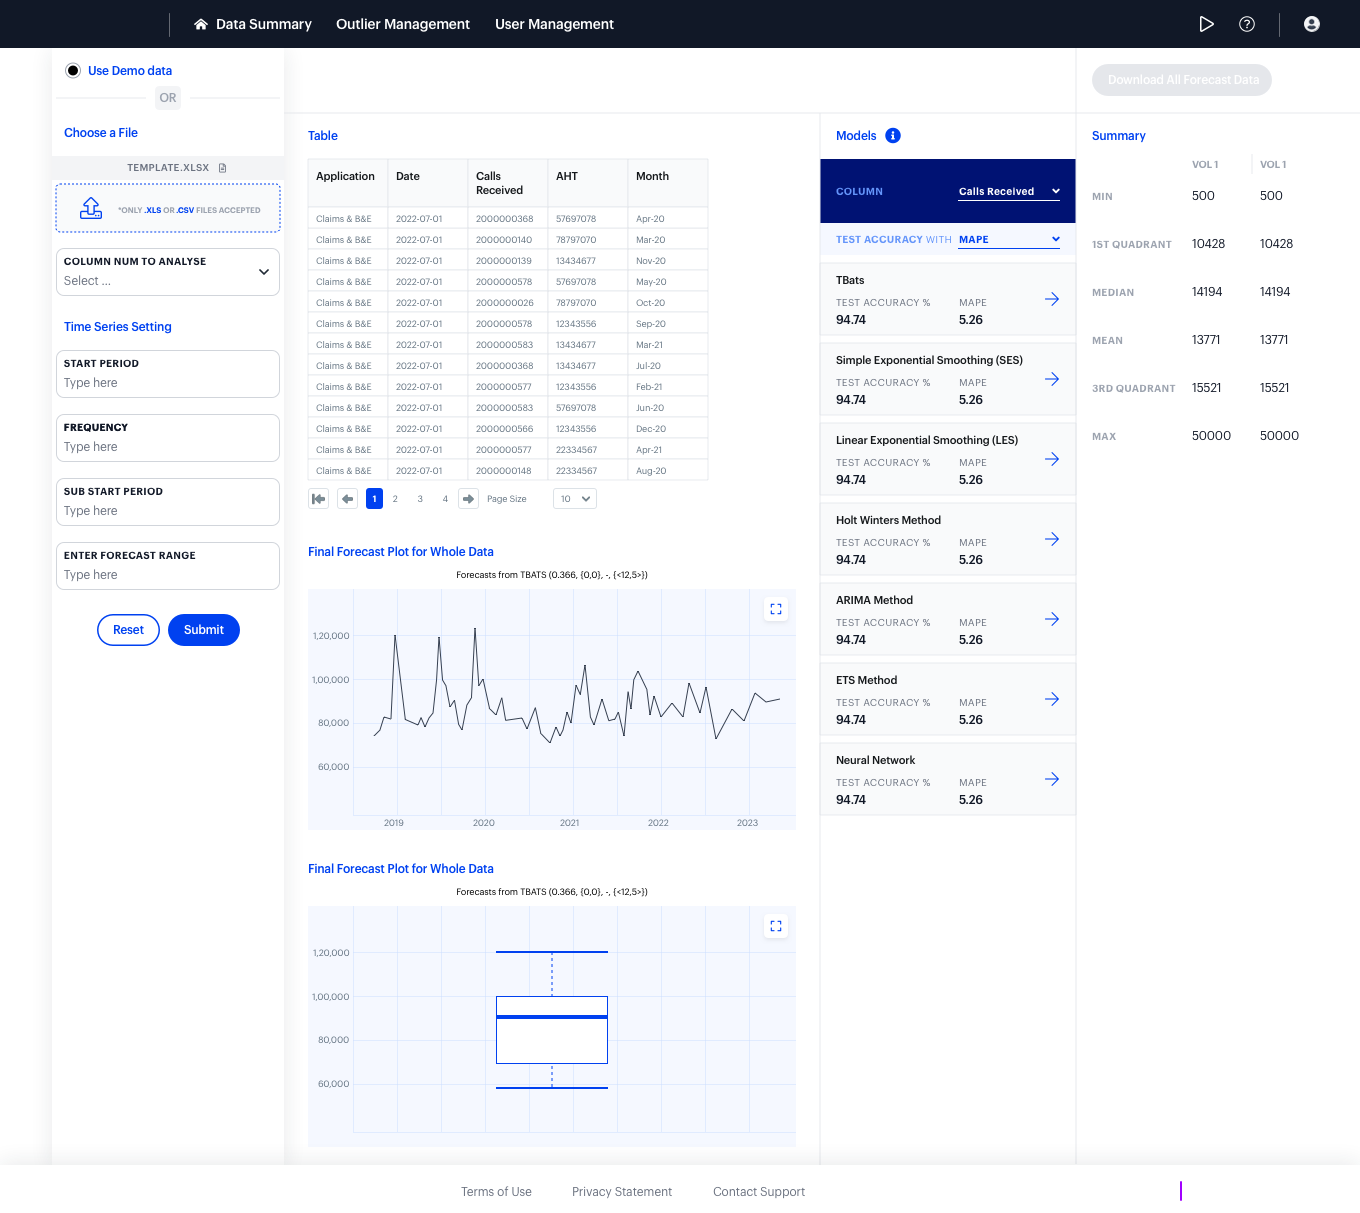
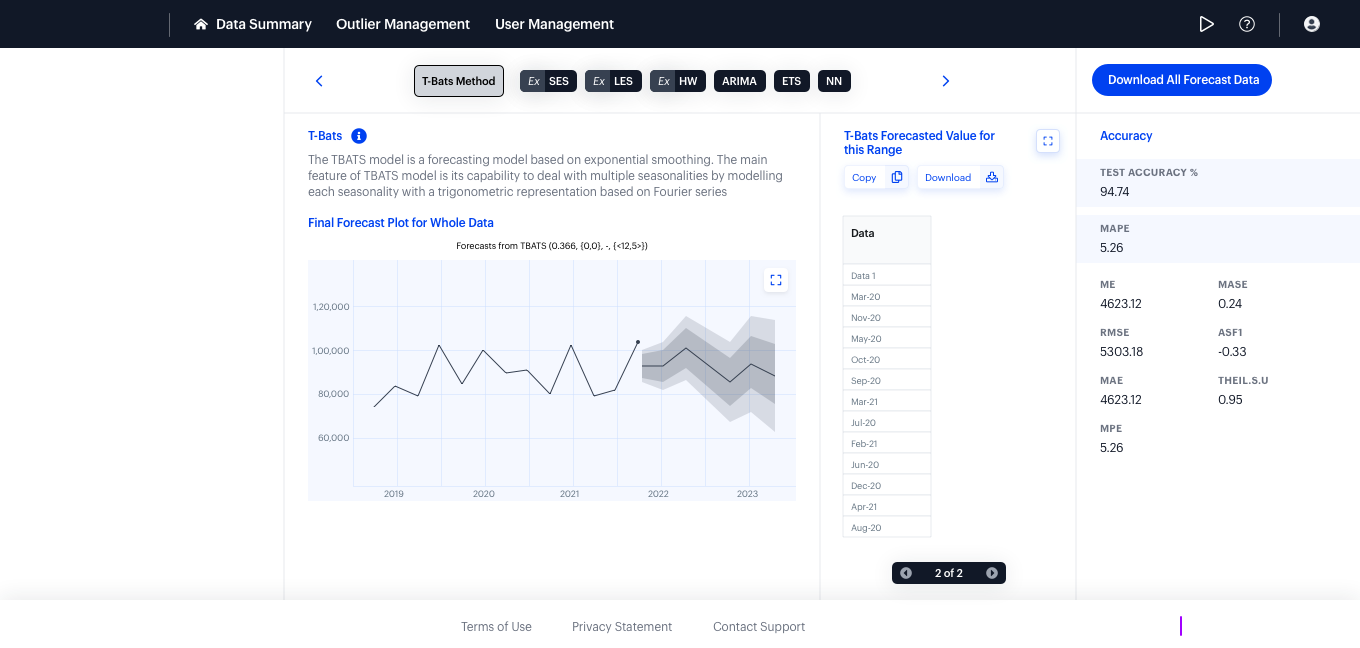
Supply and operations planners were comparing forecasting models by eye, flipping between spreadsheets exported from different statistical engines. There was no single view to see which model actually fit a given SKU's seasonality, so decisions defaulted to whichever model planners knew best — not necessarily the most accurate one.
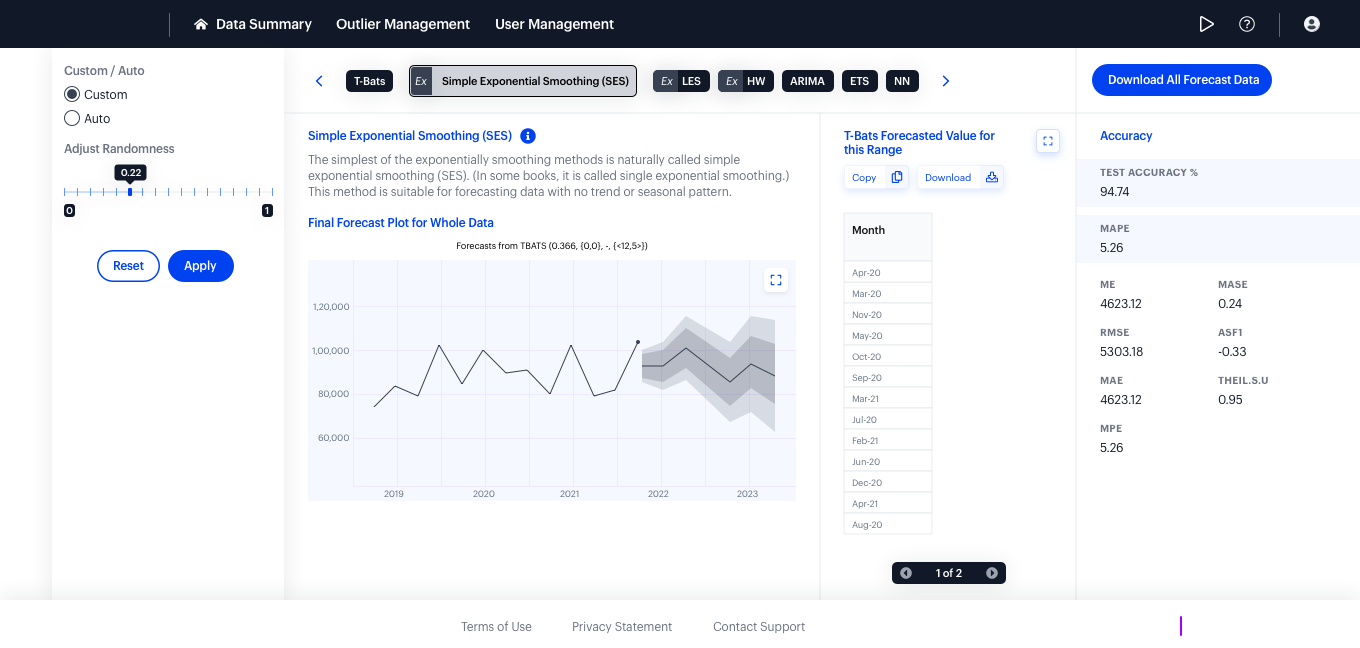
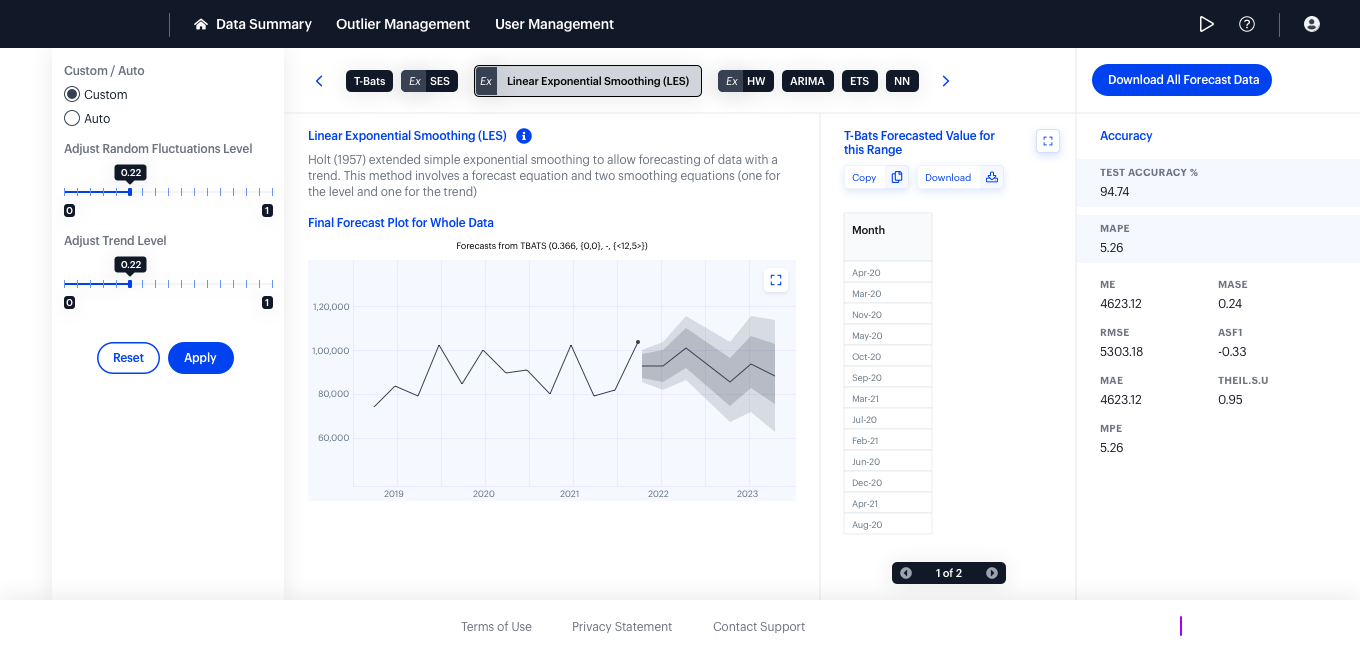
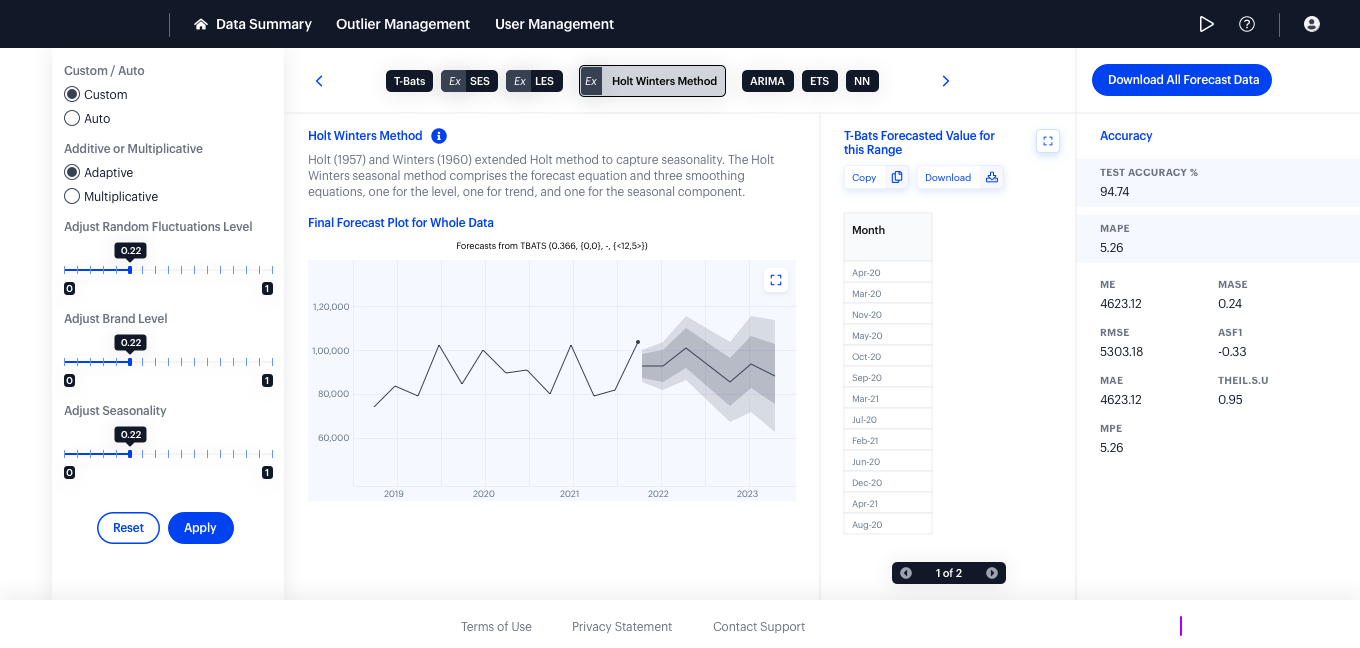
I designed a single comparison view that plots TBATS, ARIMA and Holt-Winters forecasts against historical demand side by side, with accuracy scoring surfaced inline so the best-fitting model is obvious at a glance. Planners can tune seasonality assumptions and watch the forecast update in place.
- TBATS
- ARIMA
- Holt-Winters
Planners could compare models and pick one directly from the chart, replacing a spreadsheet-and-explanation workflow with a single screen anyone on the team could read.