Finance · Data Visualization
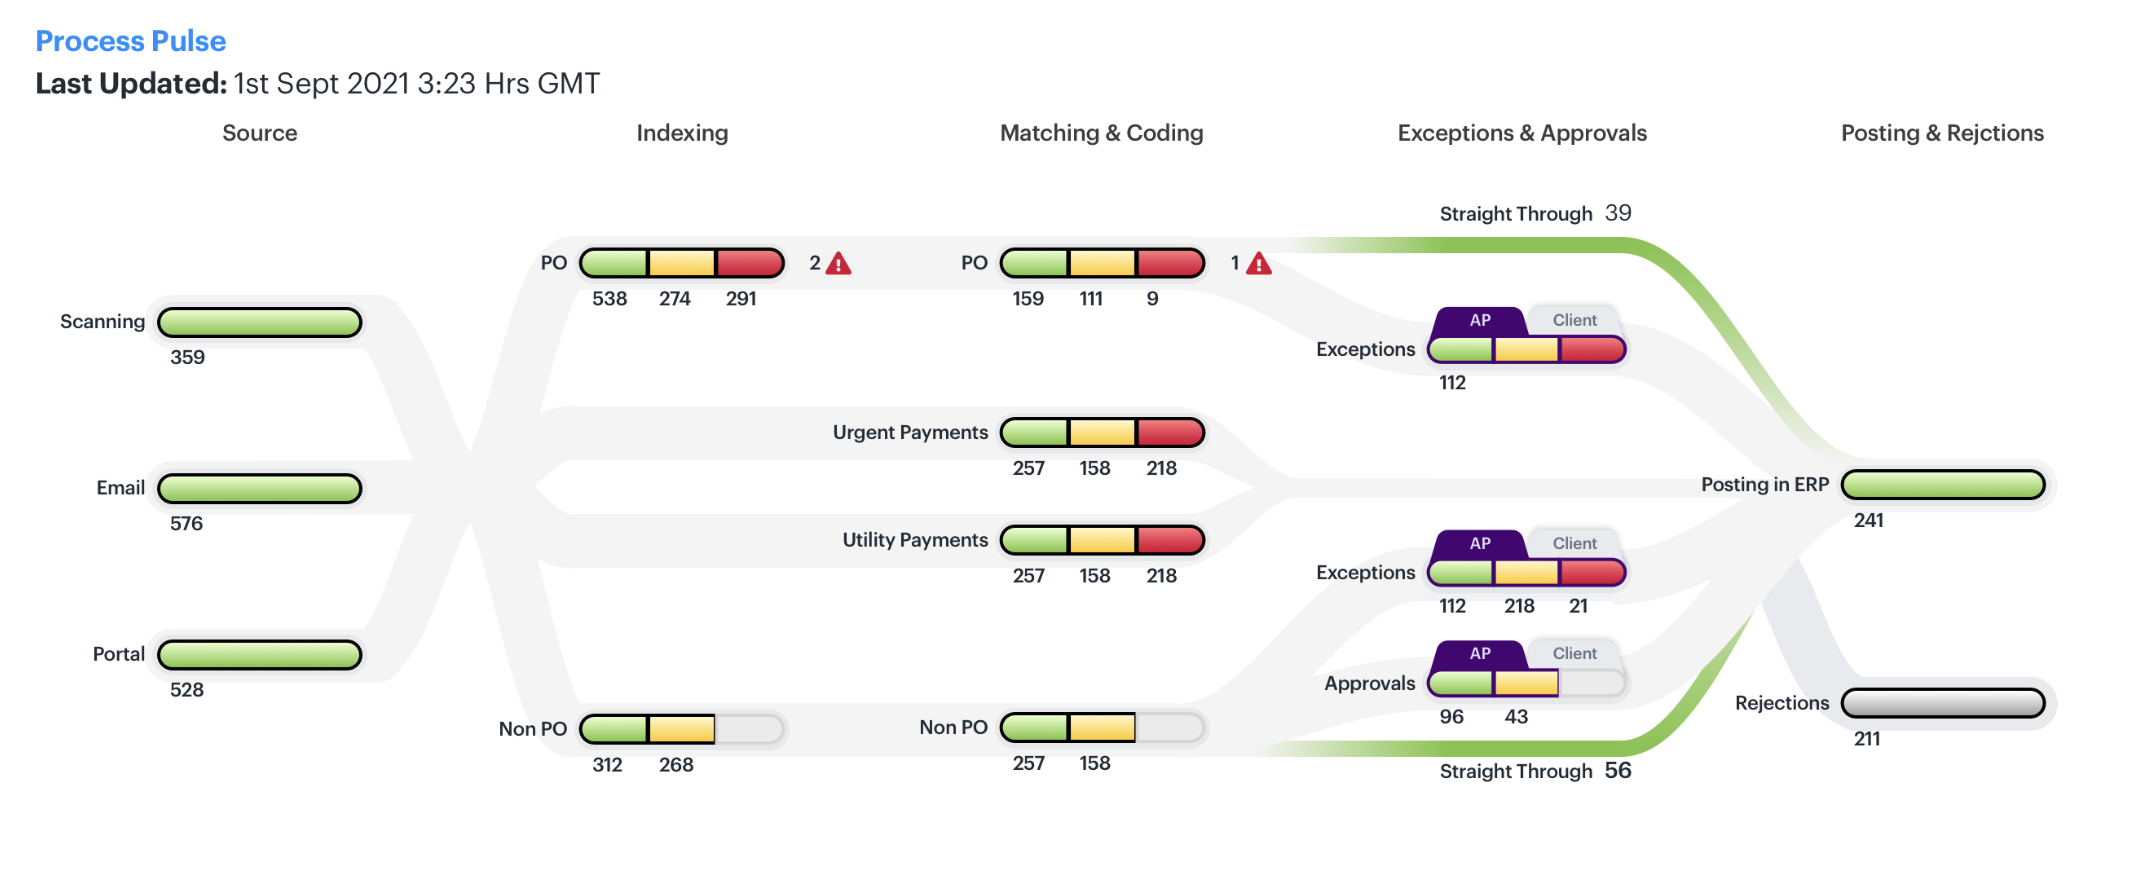
Process Pulse
Turning a five-stage procure-to-pay pipeline into a single, readable flow.
A Sankey-based dashboard that traces every invoice through sourcing, indexing,
matching, exceptions, and posting — surfacing straight-through rates and
exception hotspots at a glance, in a process that used to take a spreadsheet
and a lot of explaining.
View project →
Supply Chain · Forecasting
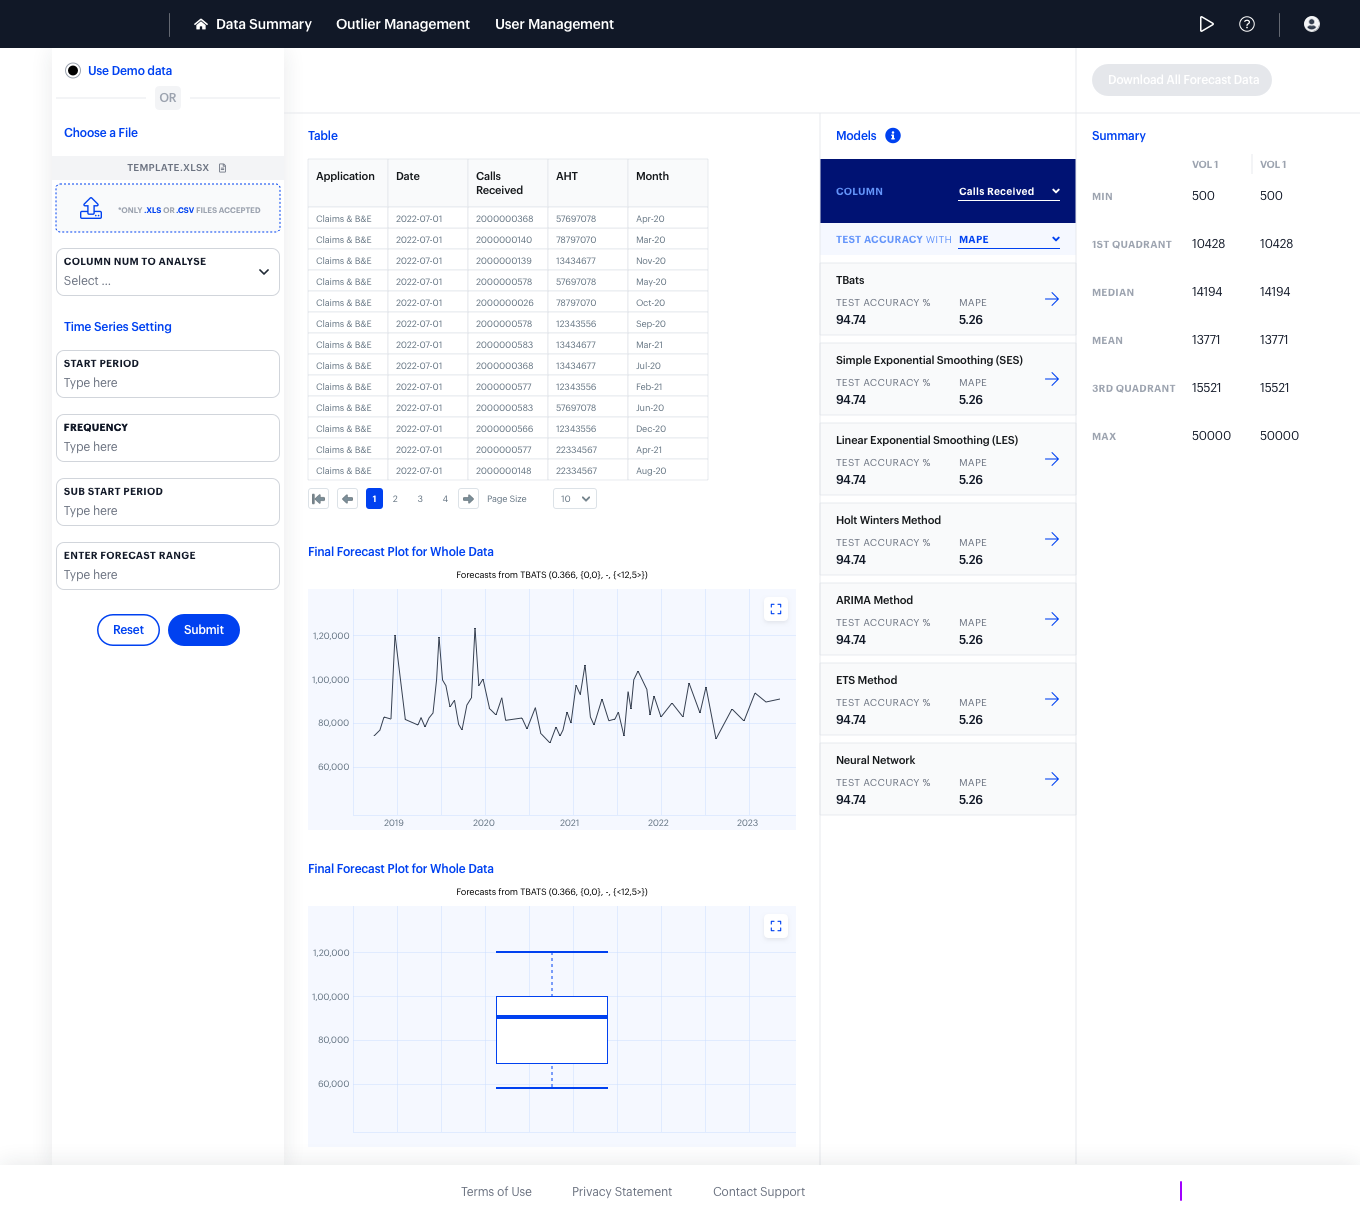
Reckoner
A forecasting workbench that makes seven statistical models feel like one simple
decision.
Planners upload demand data, compare models — TBATS, ARIMA, Holt-Winters, and
more — side by side on accuracy, and tune seasonality and trend without
touching a formula. The hard part was making statistical forecasting legible
to people who aren't statisticians.
View project →
Operations · Transition Management
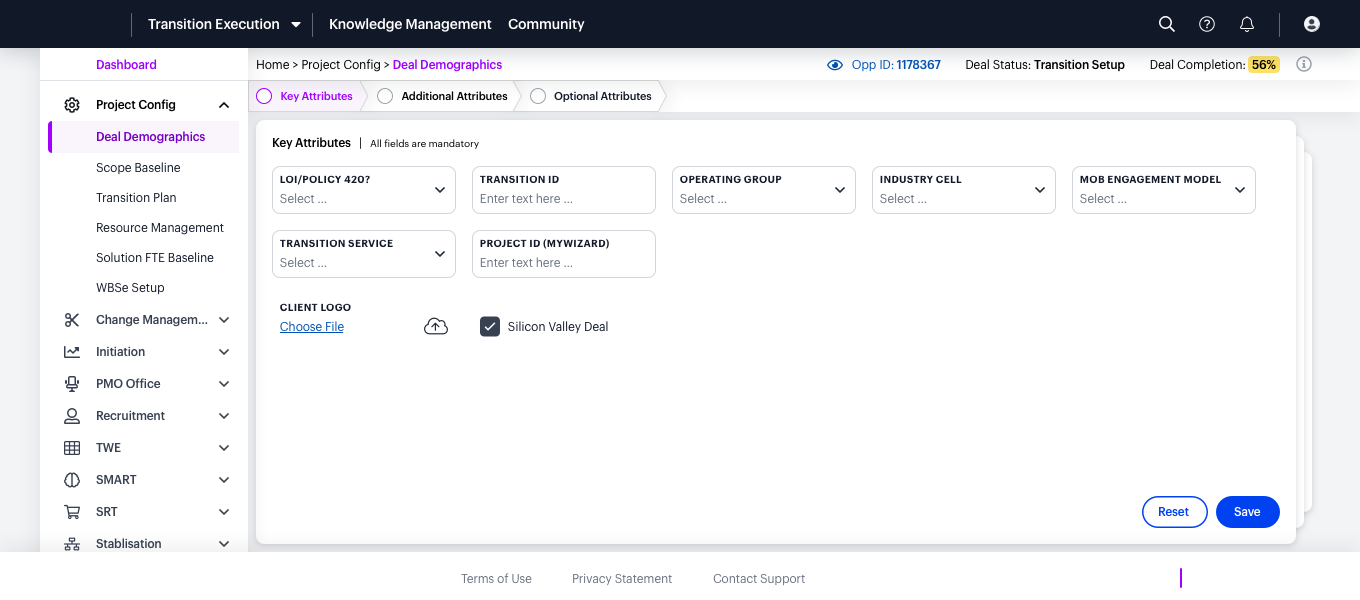
Nest
The workspace that guides teams through standing up a new client transition.
From deal demographics to workstream timelines, Nest structures the dozens of
configuration steps a transition team has to get right — replacing scattered
trackers with one guided, step-by-step setup.
View project →
Presentations · Landing Pages
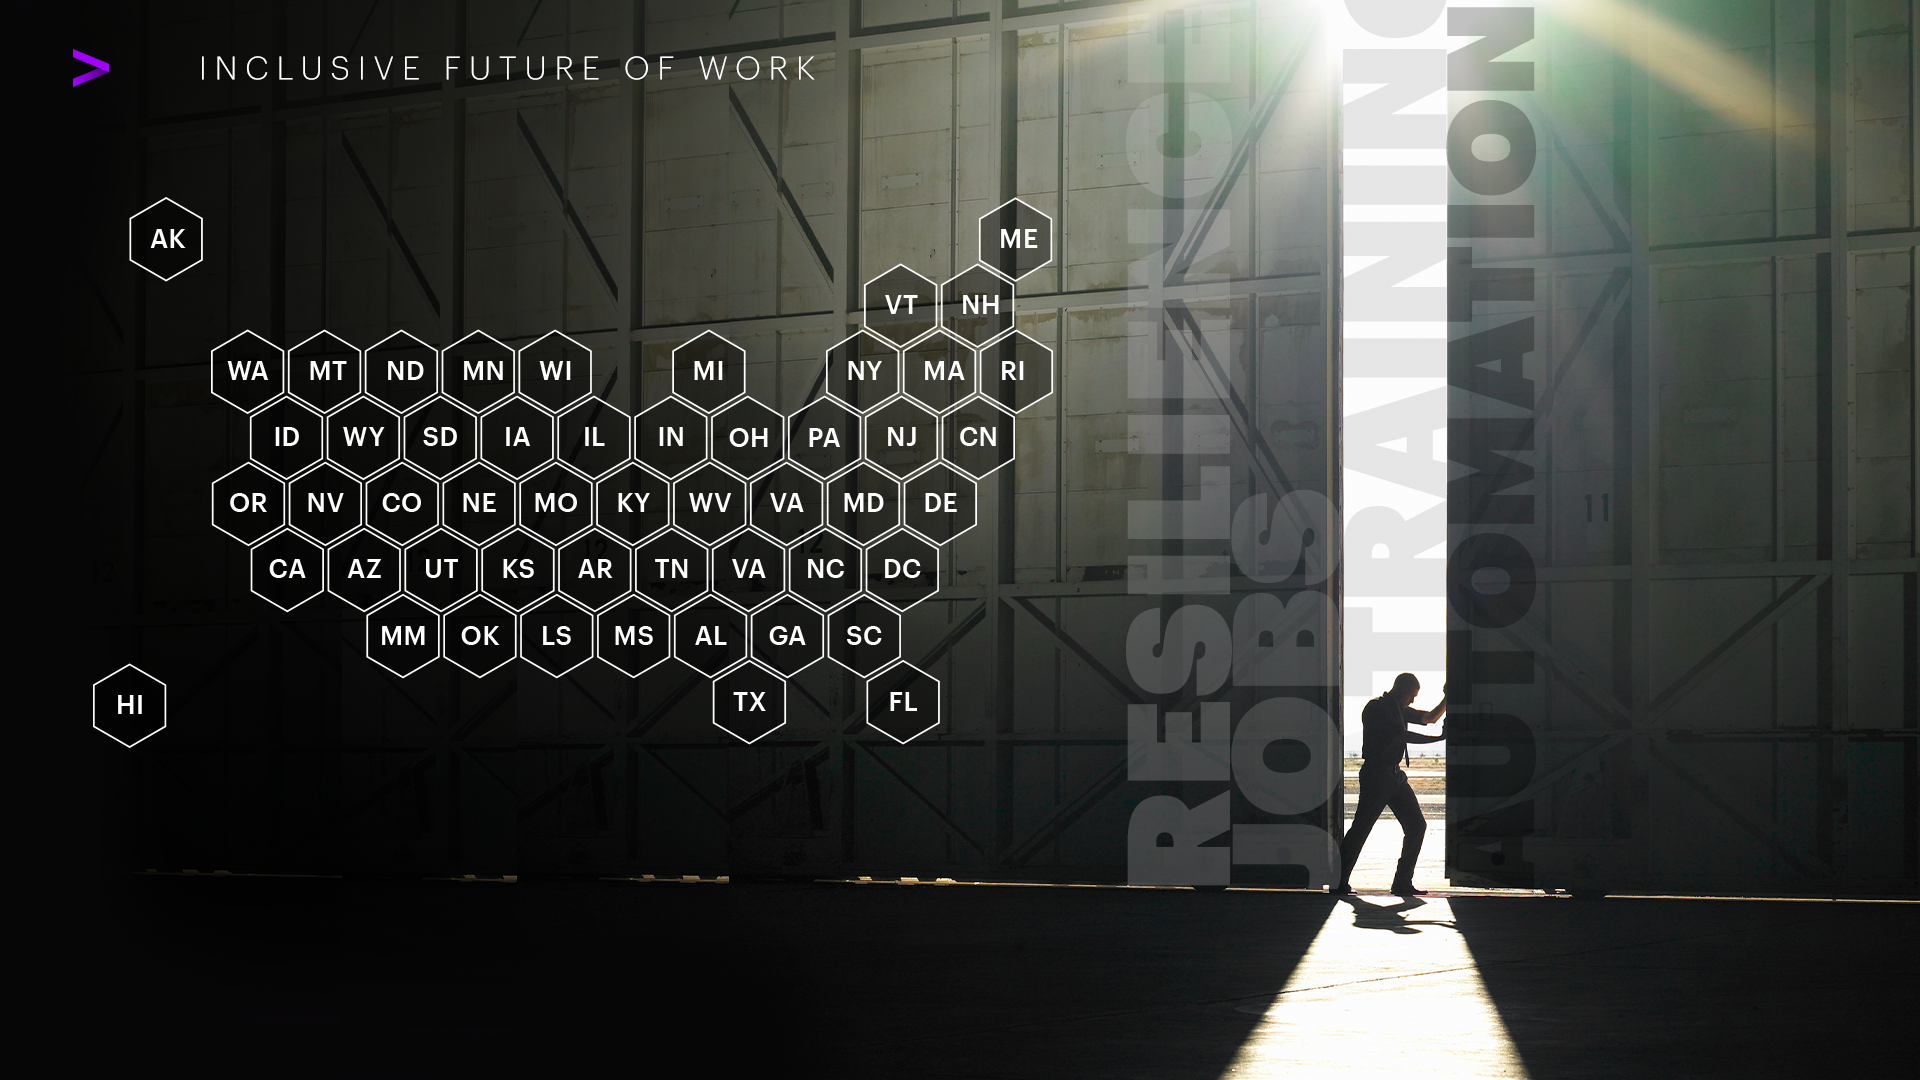
Landing Pages
Presentation-ready landing pages built for high-stakes client pitches.
A set of landing pages designed for internal presentations ahead of high-stakes
potential client pitches — turning a pitch narrative into a polished, single-page
story the team could walk a client through with confidence.
View project →